

https://github.com/TBEDP/datavjs
DataV.js Тў»СИђСИф JavaScript уџёТЋ░ТЇ«тЈ»УДєтїќт║Њ№╝їУЄ┤тіЏС║јТјетіеТЋ░ТЇ«тЈ»УДєтїќтюеТЎ«жђџСИџтіАуџёУљйтю░т║ћућесђѓ ТѕЉС╗гуџёуЏ«ТаЄТў»№╝џ
тЄАТюЅТЋ░ТЇ«тюетцё№╝їуџєУЃйтЈ»УДєтїќ
- APIТќЄТАБ
- С╗╗ТёЈуќЉжЌ«№╝їУ»иуД╗УЄ│т║ЋСИІУЂћу│╗С║║жЃетѕєтЇ│тЈ»сђѓ
т«ЅУБЁ
уЏ«тЅЇтцёС║јт╝ђтЈЉСИГ№╝їт╣ХТюфreleaseТГБт╝ЈуЅѕТюг№╝їтдѓжюђСй┐уће№╝їУ»ижЄЄућетдѓСИІТќ╣т╝Ј№╝џ
$ git clone git://github.com/TBEDP/datavjs.git
жюђУдЂТ│еТёЈуџёТў» example уЏ«тйЋСИІуџёСЙІтГљСИГТюЅ ajax тГўтюе№╝їТЅђС╗ЦСйажюђУдЂСИђСИфТюЇтіАтЎеТЮЦТЅўу«АУ┐ЎС║ЏжЮЎТђЂТќЄС╗Хсђѓ
СйаС╣ЪтЈ»С╗ЦУ»ЋућетЪ║С║ј DataV.js т╝ђтЈЉуџё ChromeТЈњС╗Х№╝їтЈ»С╗ЦтюеС╗╗ТёЈуйЉжАхСИГт░єУАеТа╝тЈ»УДєтїќсђѓ
Examples

Quick start
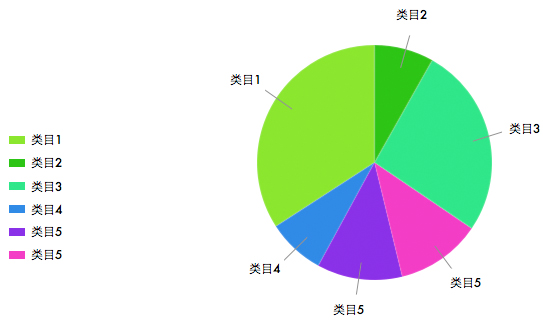
ТГцтцёС╗ЦPieтЏЙСИ║СЙІсђѓ
т╝ЋтЁЦСЙЮУхќ
<script src="path/to/build/datav.js"></script>
<script src="path/to/charts/pie.js"></script>
тЄєтцЄТЋ░ТЇ«
var source = [ ['тїЌС║г', 50265], ['СИіТхи', 60555], ['т╣┐тиъ', 38544], ['Ти▒тю│', 27276], ['УЦ┐т«Ѕ', 20506], ['ТўєТўј', 26916], ['ТГдТ▒Ѕ', 17636], ['ТІЅУље', 977], ['тЊѕт░ћТ╗е', 10406], ['С╣їж▓ЂТюежйљ', 6695] ];
ТИ▓ТЪЊтЏЙУАе
// тѕЮтДІтїќу╗ёС╗Х
var pie = new Pie("container", {width: 1000, tag: true});
// Ти╗тіаТЋ░ТЇ«Т║љ
pie.setSource(source);
// ТИ▓ТЪЊ
pie.render();
у╗ЊТъю№╝џ
Requirements:
Learn more?
- The example site: http://datavlab.org/datavjs/
- API Docs
Contributors
Thanks goes to the people who have contributed code to this library, see the GitHub Contributors page.
Below is the output from git-summary
$ git summary
project : datavjs
repo age : 1 year
active : 159 days
commits : 431
files : 276
authors :
305 Jackson Tian 70.8%
46 jdk137 10.7%
25 xie cong 5.8%
18 gozo1234 4.2%
11 Theseue 2.6%
8 xiecong 1.9%
8 wxtheseue 1.9%
4 Jiang Dongke 0.9%
3 жЃГТќ╣УѕЪ 0.7%
2 unknown 0.5%
1 arcthur 0.2%
License
DataV.js is available under the MIT License.


